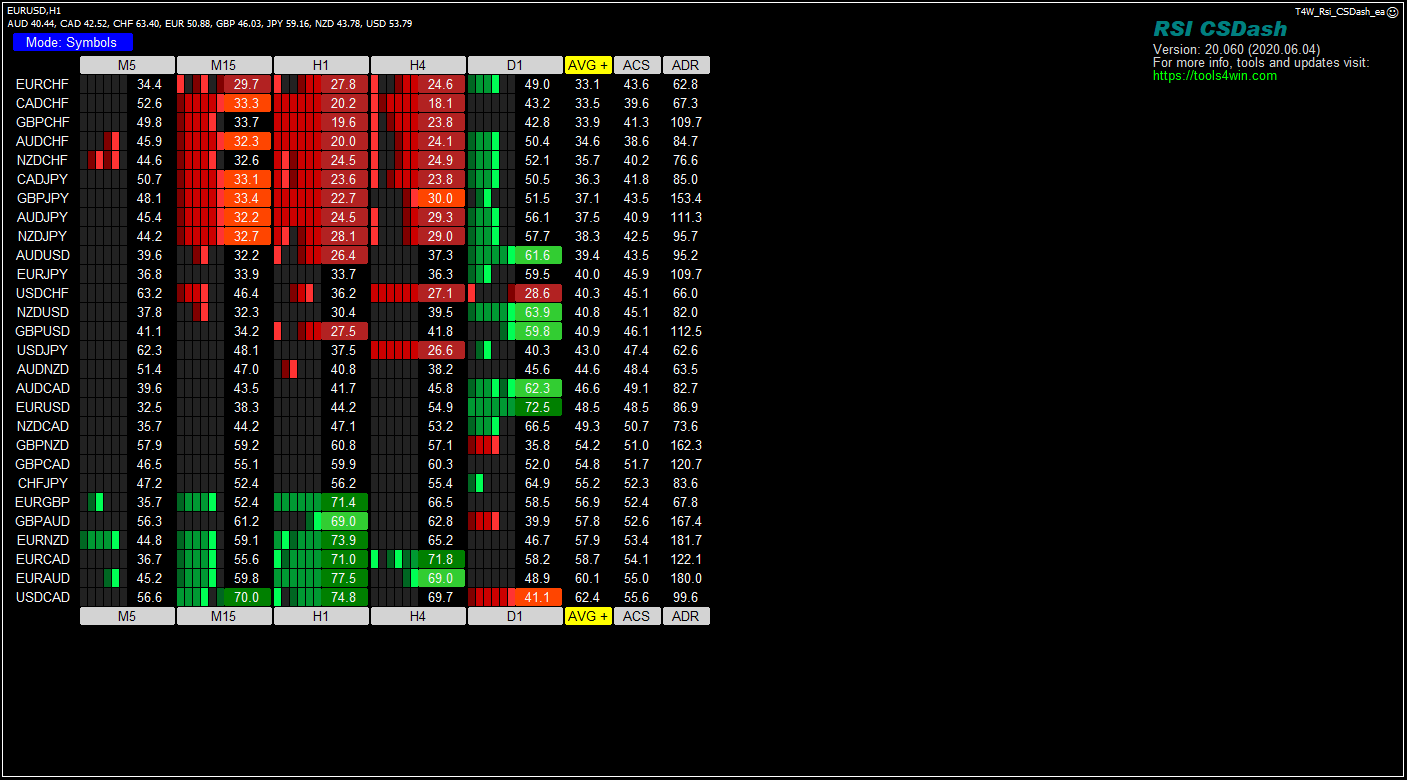
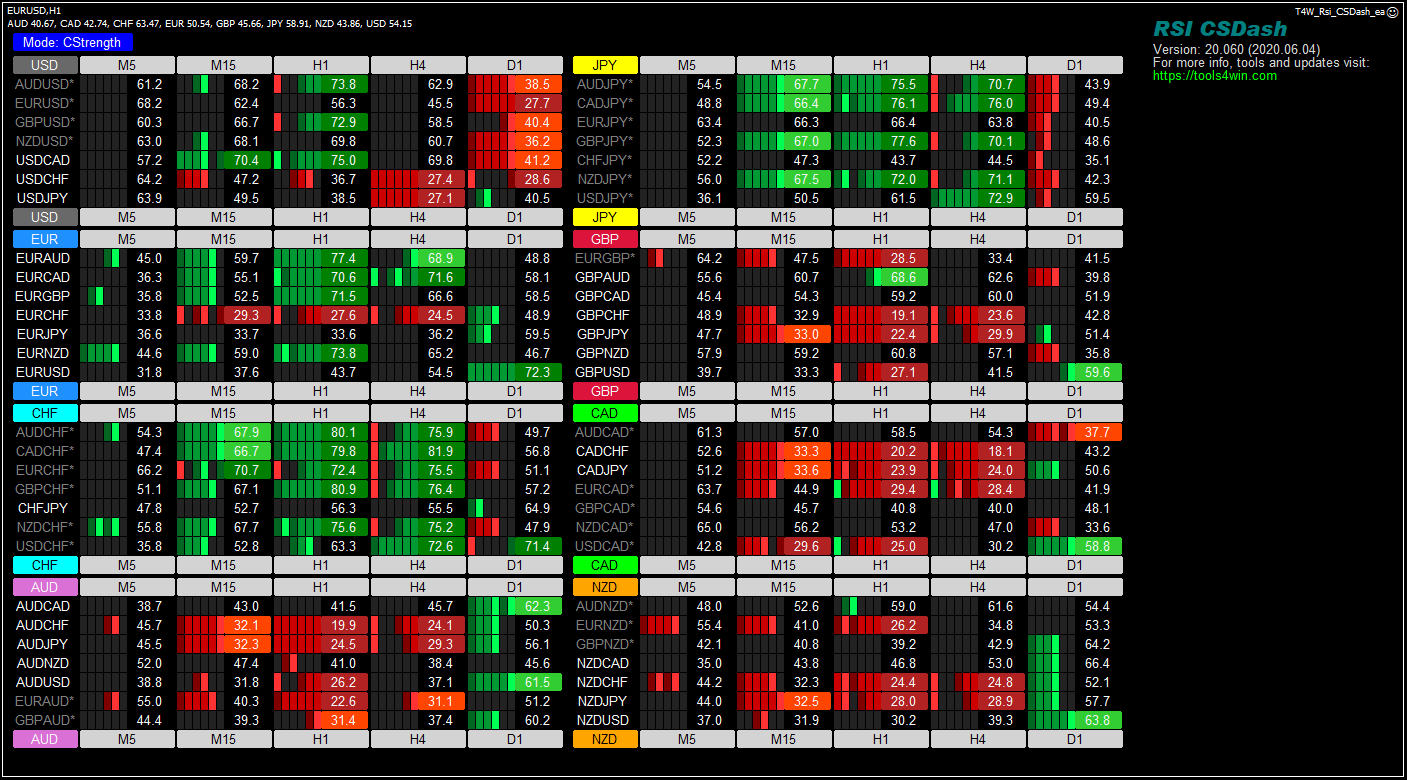
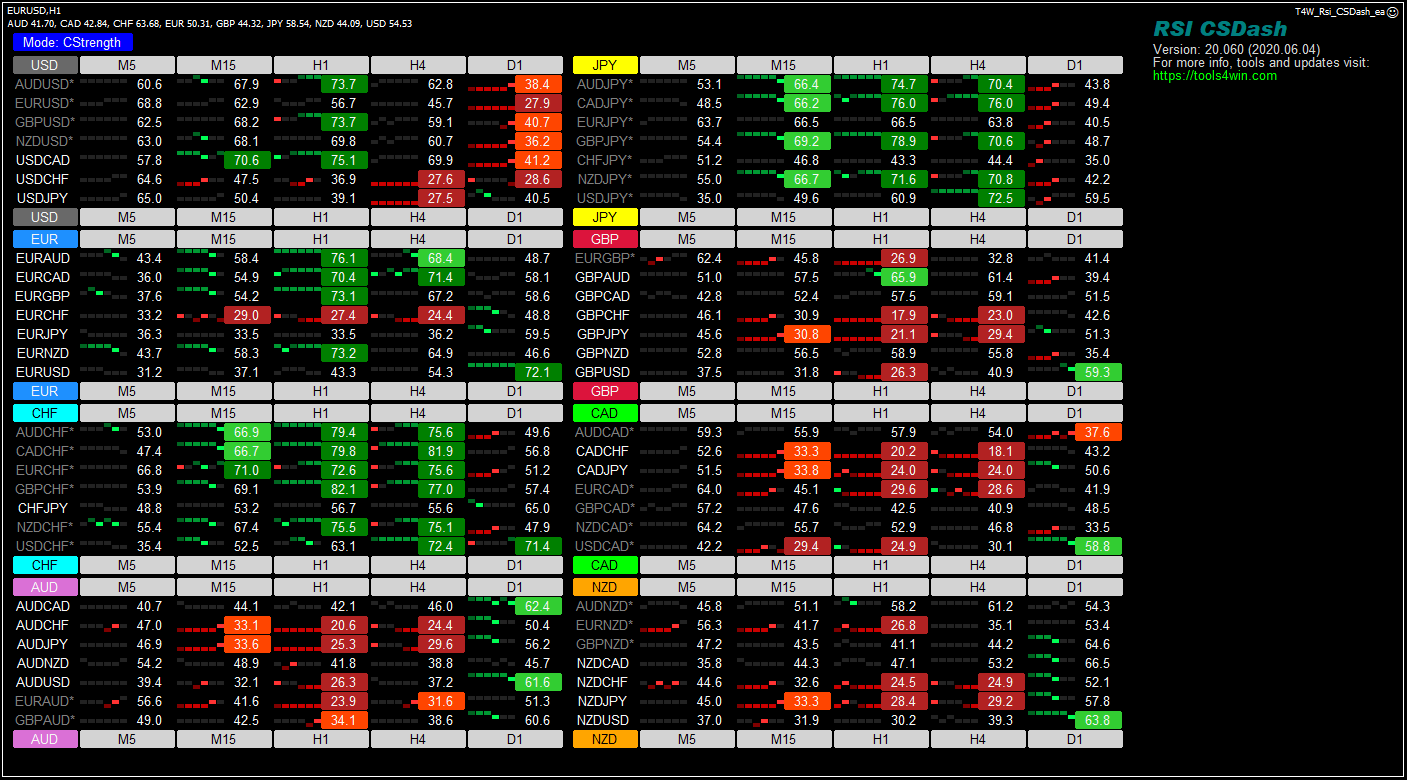
Compare RSI across forex pairs and timeframes in MT4, with currency strength views and recent values. Free RSI dashboard with adjustable period and levels.
What the values mean
The dashboard calculates RSI from closing prices for each symbol and selected timeframe. RSI runs from 0 to 100: higher values indicate stronger recent gains relative to losses. Currency views combine the pair readings with the direction of each currency in the pair taken into account.
Settings and interpretation
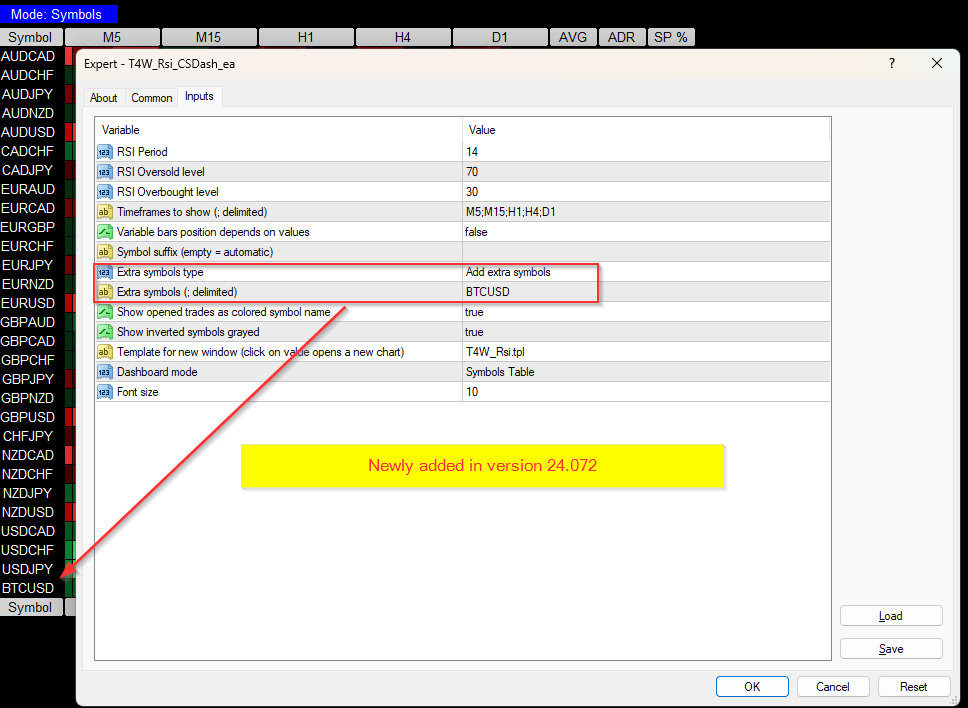
The released version uses a 14-bar RSI by default, with upper and lower levels of 70 and 30. Change the RSI period, levels and timeframe list in Inputs. The level labels in the released Inputs dialog are reversed: the default 70 is the upper level and 30 is the lower level.
An extreme RSI reading is not an automatic reversal signal. RSI can remain high or low during a sustained move. Read the pair chart and the higher-timeframe context before interpreting a colour or rank. The current bar changes until it closes.
Main features
- RSI readings for multiple forex symbols and timeframes.
- Currency and symbol views, with recent-value strips.
- Adjustable RSI period and upper/lower levels.
- Open a symbol chart by clicking its value.
- Version
- 24.072
- Released
- 2024-03-20
- Platform
- MT4
- Price
- Free
Download
t4w_rsi_csdash_ea.zip
Version 24.072 (2024-03-20) · free, no account needed.
The ZIP contains the .ex4 file for MetaTrader 4, screenshots and installation instructions.
New here? Read the installation guide first.