Currency Strength Dashboards (csdash) for MT4
Table of contents
List of dashboards
Main benefits of CSDash
Complete market overview in one chart
With Price Action strategy, it is recommended to see high timeframes before considering the lower ones (to view the whole context)
It also provides with a view from other currency pairs (currency strength)
Display on one chart reduces CPU load (instead of display on multiple charts)
Choose your favorite method for market analysis (see the dashboards list below)
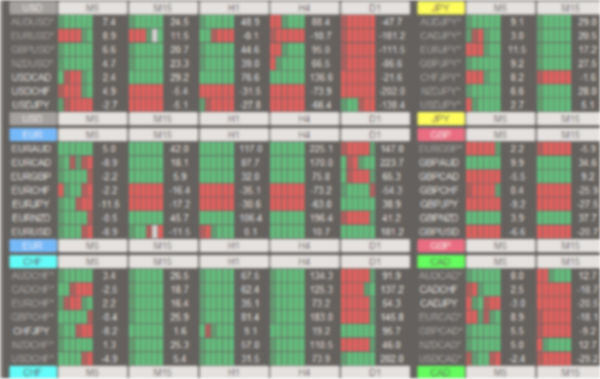
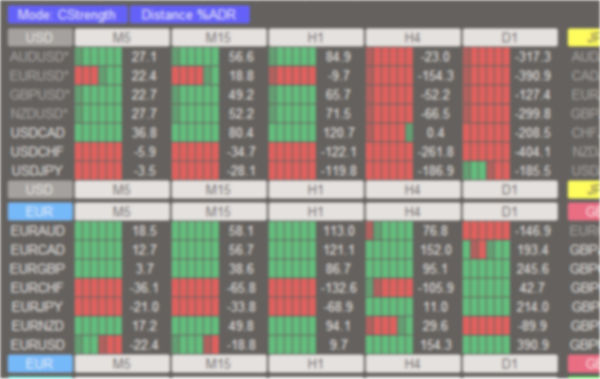
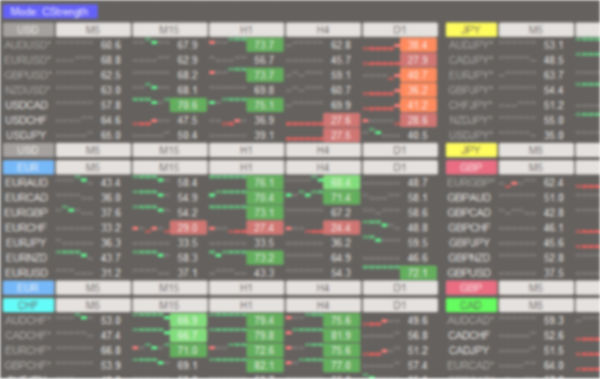
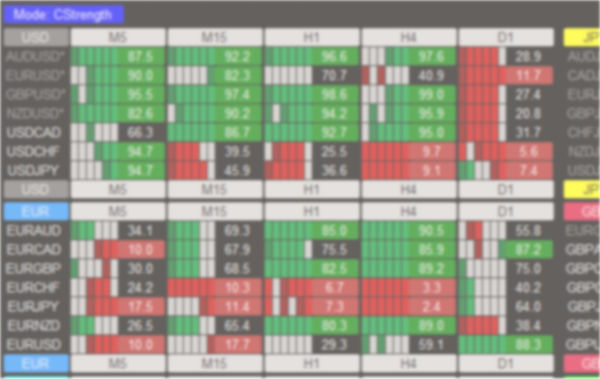
Currency strength
Shows strong / weak currencies and pairs from all majors (USD pairs) + crosses
Progress display
The classic "currency strength" indicators show only the current value. Our CSDash shows also the change in time over the last n bars
You can turn on dynamic bar size depending on the historical value and the previous trend direction
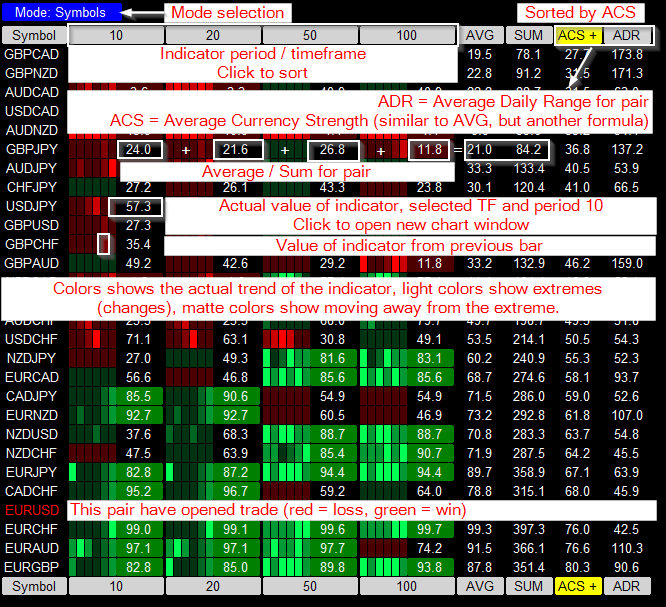
Clicking on a value (not a stripe) will open a new chart window
Each dashboard has a "Template for new window" parameter, where you can set a template name (.tpl file name) to open in a new chart window
Optimized for best performance
Dashboards are designed to load the CPU as little as possible
Alerts
Receive alerts about important market changes for opportune entry / exit
In progressJuly 2020
Trading functions
"Basket trading" from one chart
SL/TP fixed / based on market volatility
Advanced money management techniques
July 2020
How to use
Complete manuals for CSDash are not currently available. But don't worry, using is simple:
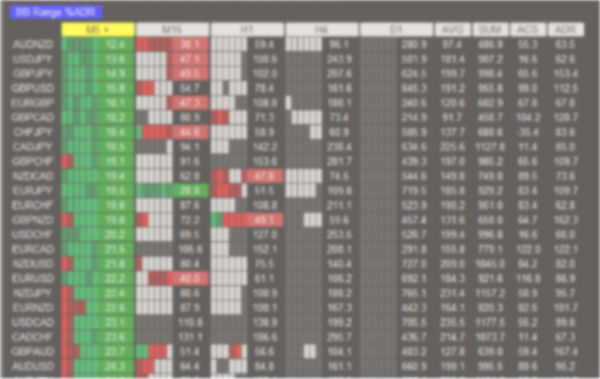
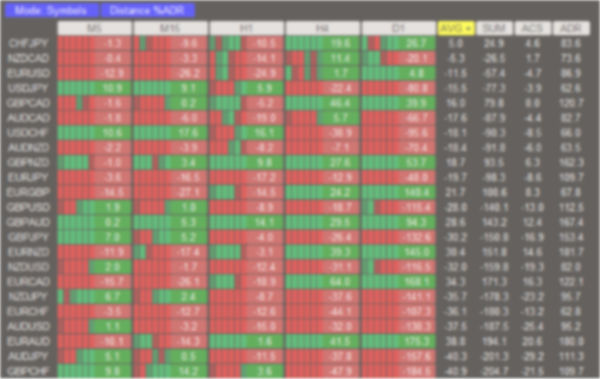
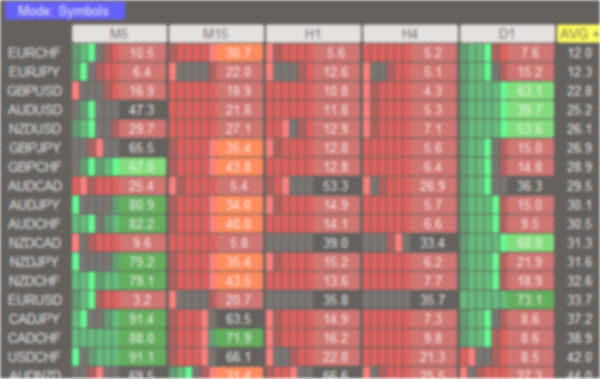
According to the standard indicator you use (RSI, Stoch, Donchian), choose a specific CSDash, which performs the calculation over all pairs + shows the strongest / weakest pair depended of the currency strengths.
Trading method: we choose one of the strongest / weakest pair from the table and trade in the direction or waiting for strong support / resistance and speculate for trend reversion. But, it is always important to check support / resistance from higher timeframes (H4 / D1)!
Colors shows the actual trend of the indicator, light colors show extremes (changes), matte colors show moving away from the extreme.
Common parameters
| Parameter name | Purpose |
|---|---|
| Timeframes to show (; delimited) | Default value is "M5;M15;H1;H4;D1" |
| Variable bars height depends on values | Shows full height of bar (false) or variable depends on historical value and trend (true) |
| Symbol suffix | Different brokers may add suffix to symbol name (a double dot, for example: "EURUSD.."); empty value = automatic detection |
| Show opened trades as colored symbol name | for your information |
| Show inverted symbols grayed | for computation of currency strength are some values reversed; it's a notice for you. For example: EURUSD in USD currency will be reversed |
| TemplateNewWindow | click on value opens a new chart on specific timeframe |
| Font size | sometimes it can be useful |