Bollinger Bands Currency Strength Dashboard
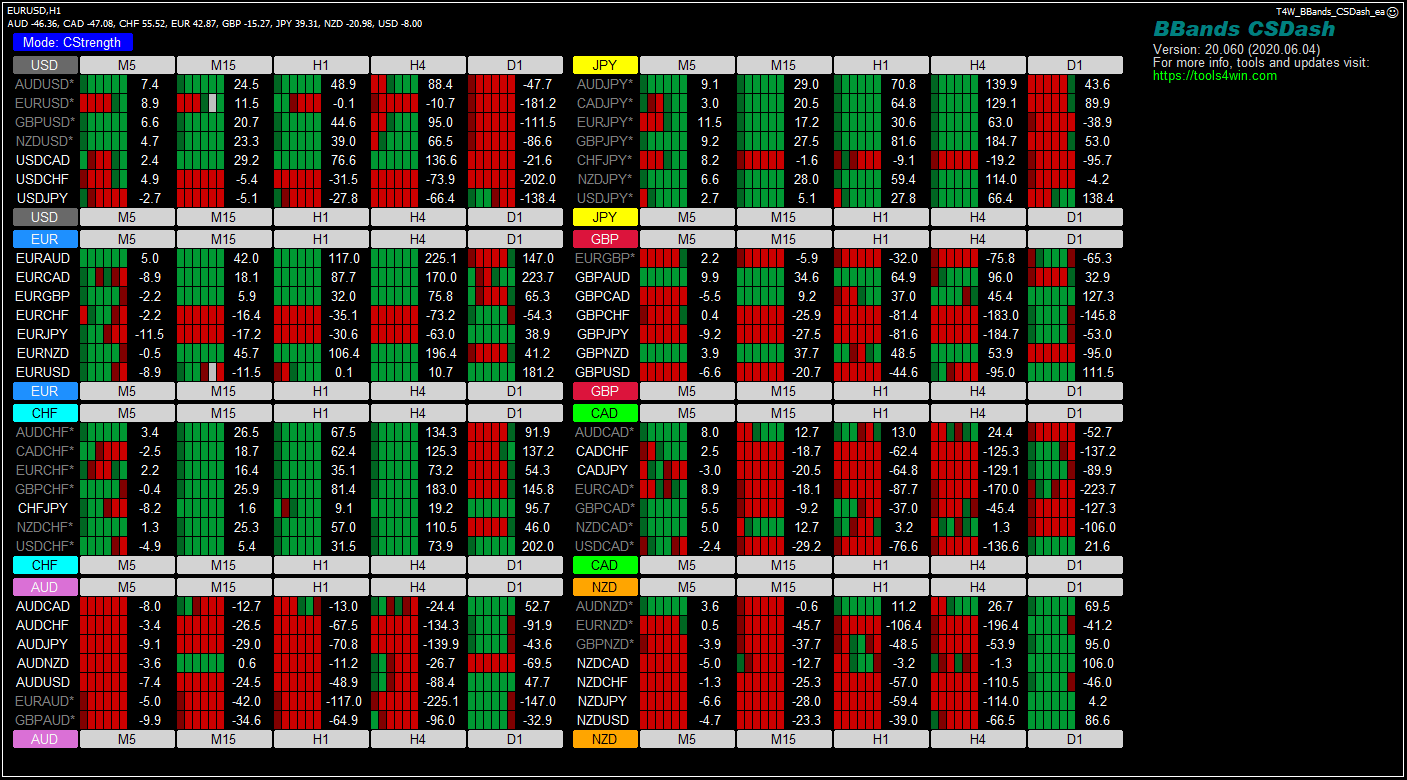
Compare the distance from the Bollinger Bands middle line across forex pairs and timeframes in MT4. Free dashboard with adjustable period and deviation.
Currency strength dashboards for MetaTrader 4. Download the ZIP, drop it in your terminal, and you are trading with it in two minutes.
For MetaTrader 4
Compare the distance from the Bollinger Bands middle line across forex pairs and timeframes in MT4. Free dashboard with adjustable period and deviation.
Compare Bollinger Bands width across MT4 symbols and timeframes, in pips or as a percentage of average daily range. A free range dashboard.
Measure price change from a rolling reference open or a candle open across MT4 forex pairs. Compare signed distances in pips or as a percentage of ADR.
Compare closing-price distance from a moving average across MT4 forex pairs and timeframes. Choose the MA method and display pips or percentage of ADR.
Compare RSI across forex pairs and timeframes in MT4, with currency strength views and recent values. Free RSI dashboard with adjustable period and levels.
Compare Stochastic readings across forex pairs and timeframes in MT4. Adjust K, D and slowing, and inspect recent values in a free dashboard.
See price position within Donchian channels across forex pairs in MT4. Compare channel periods or timeframes with the free Turtle dashboard.
You can add more symbols to existing ones, or choose symbols to display.
This applies to all dashboards for Metatrader 4.
Everything here is free because it started as our own trading setup. If it saves you time, buy us a coffee — that is the whole business model.
Tools4Win · from traders to traders